PowerPoint Timeline Templates: Page 4
 |
Represent growth over time with a range of creative and easy to understand metaphors like growth stages of plants, human beings or trees. You can add data and numbers or list of events against each stage. |
Page 4: Growth Concept
Click on thumbnails below to view details and download:
|
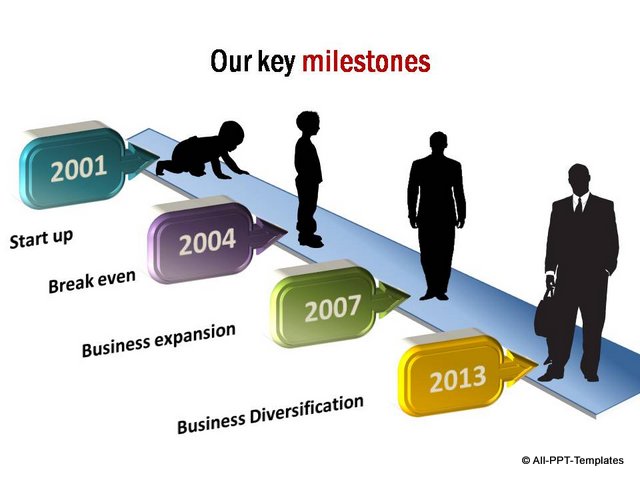
Growth Timeline with metaphor of businessman |
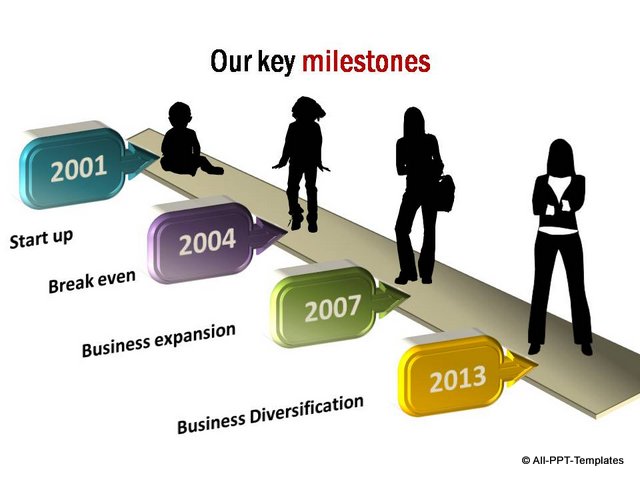
Growth Timeline with businesswoman silhouette |
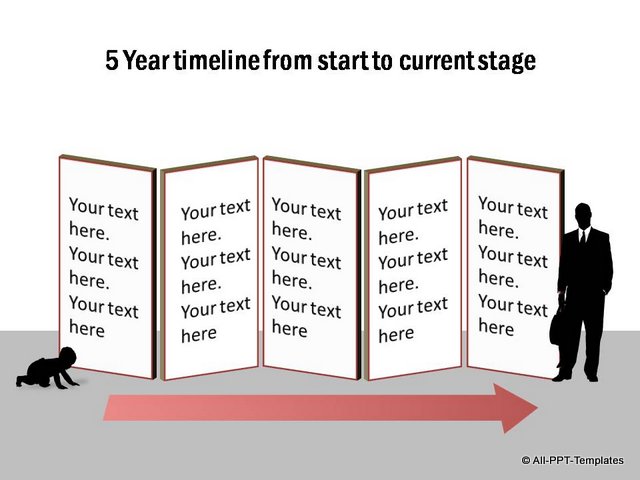
5 year timeline chart from infancy to adulthood |
|
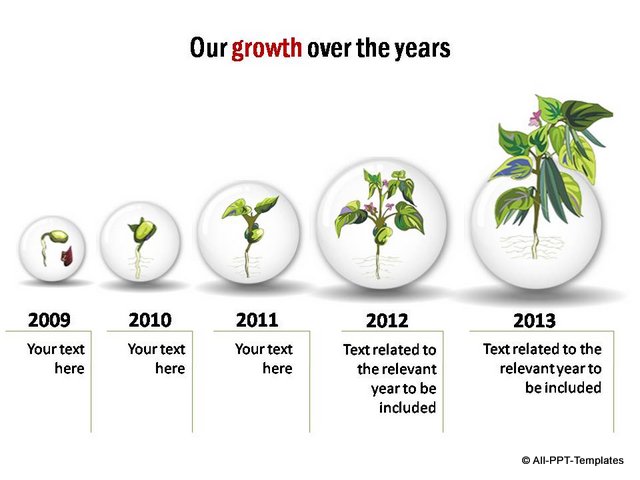
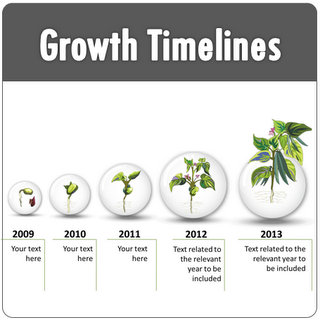
Growth Timeline shown with the metaphor of plant |
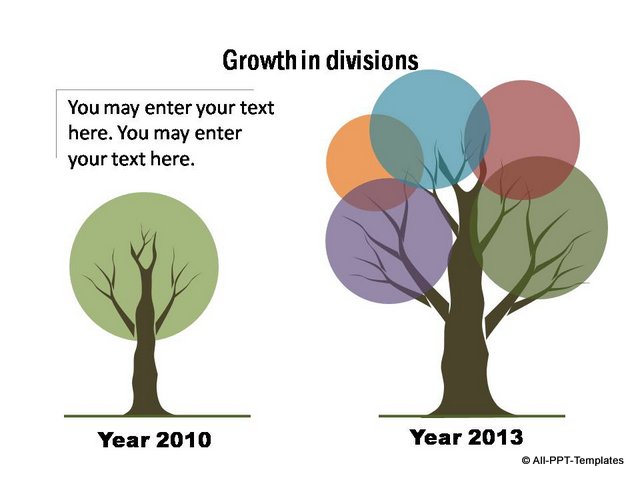
Branch Growth Timeline with colorful circles |
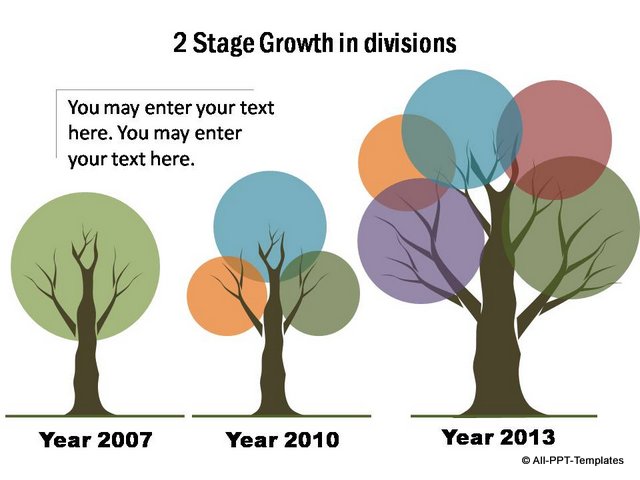
Branch Growth Timeline shown with 3 stages | ||
|
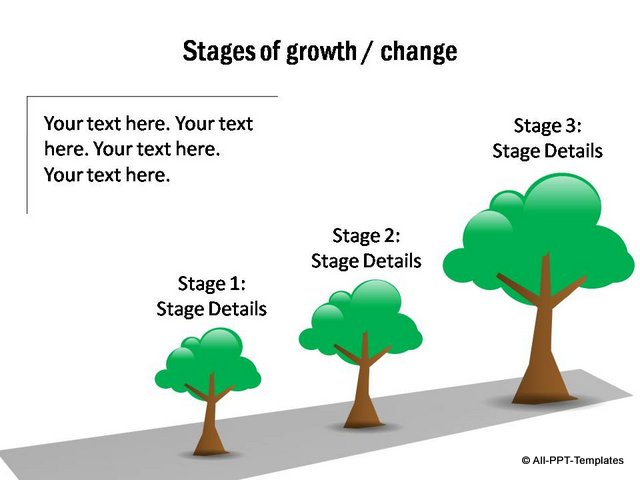
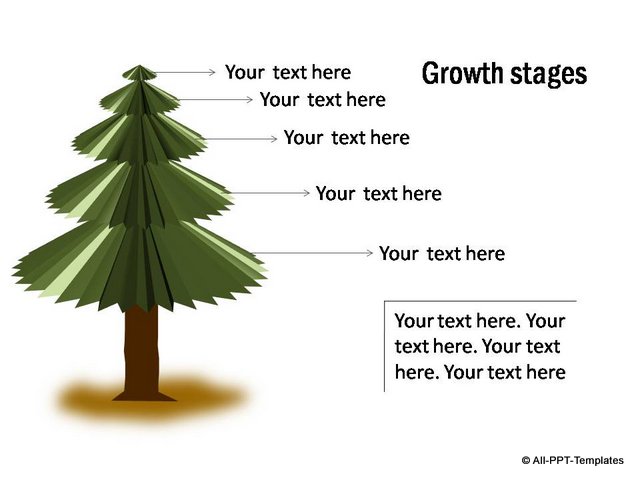
Stages of growth with fully editable trees |
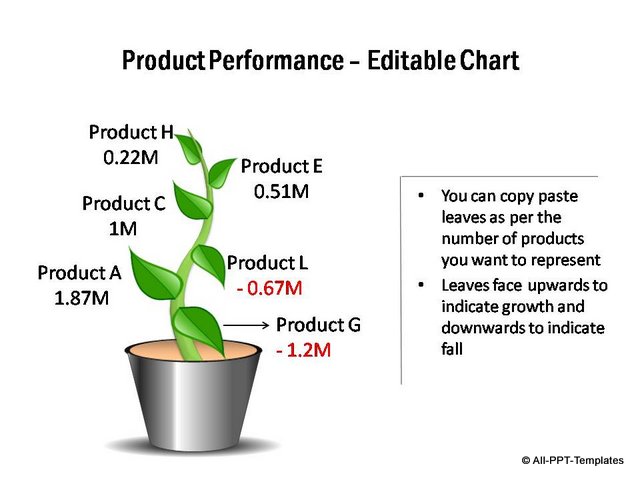
Editable product performance graphic with details |
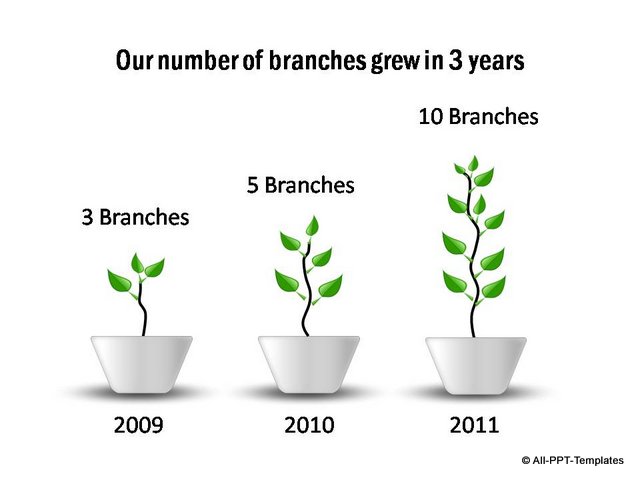
Branch growth shown in 3 stages as a potted plant | ||
|
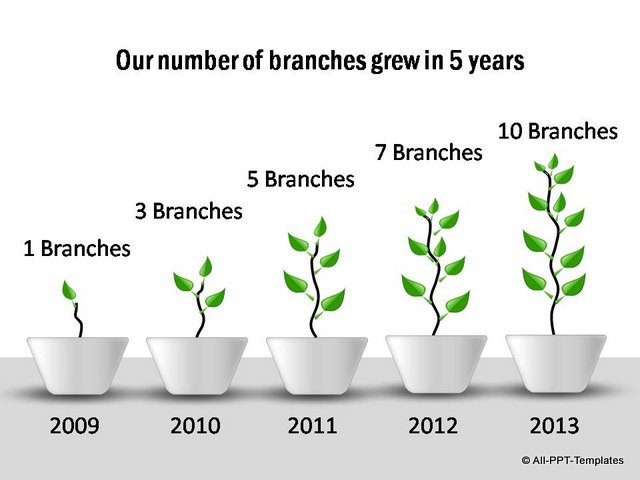
Branch growth shown in 5 stages as a potted plant |
Fully Editable tree branches - a metaphor diagram |
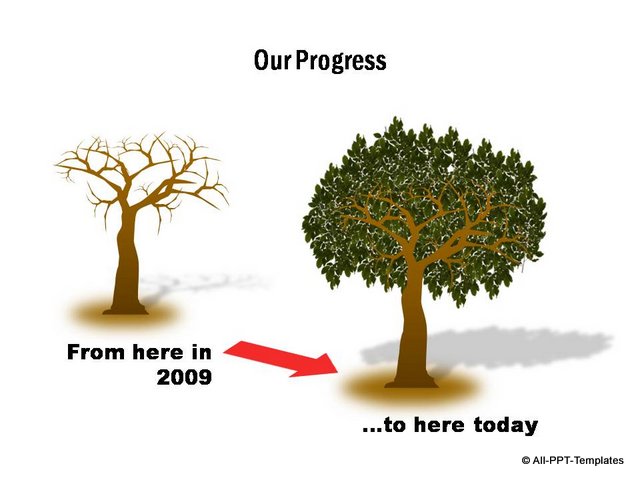
Concept of tree growth from nothing to success |
Continuous stages
|
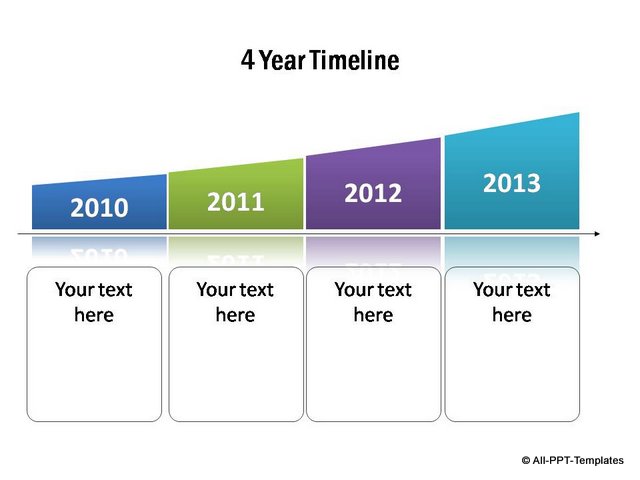
Stylish curved timeline template for 4 years |
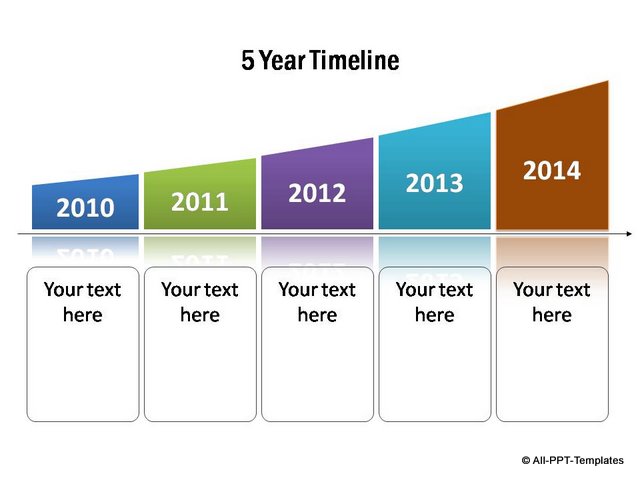
Stylish curved timeline template for 5 years |
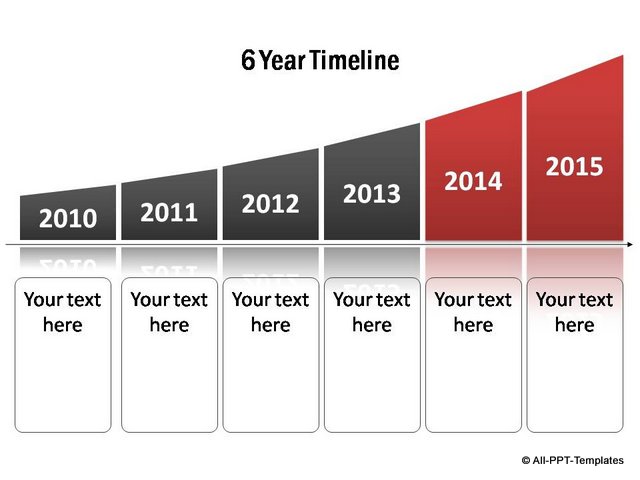
Curved Chart for 6 periods with 2 periods highlighted. | ||
|
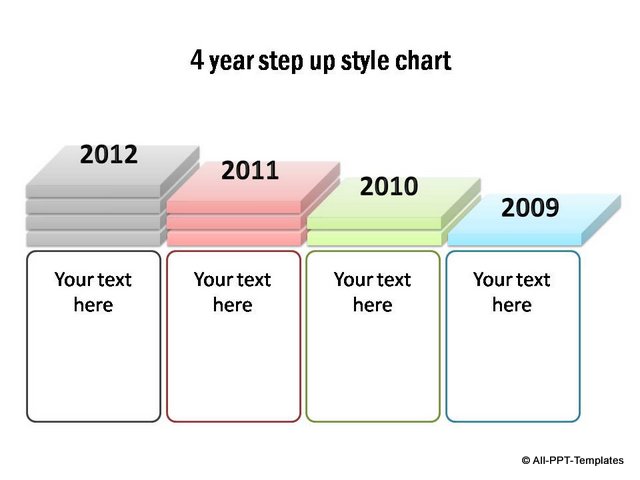
4 Year step up style chart showing growth. |
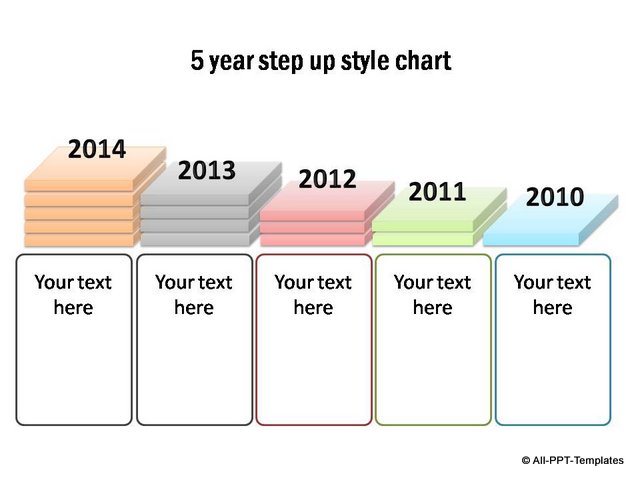
5 Year step up style chart showing growth. |
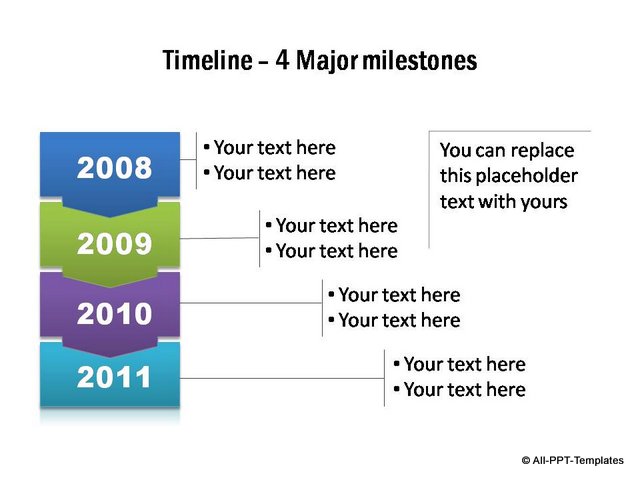
Creative Arrows showing details of 4 major milestones | ||
|
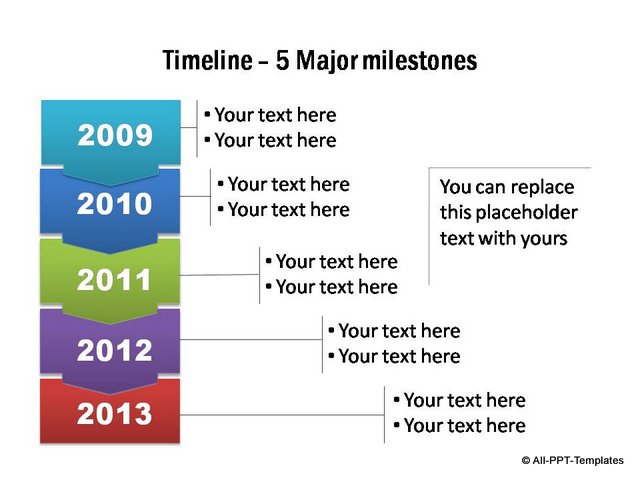
Arrows to show details of 5 major milestones |
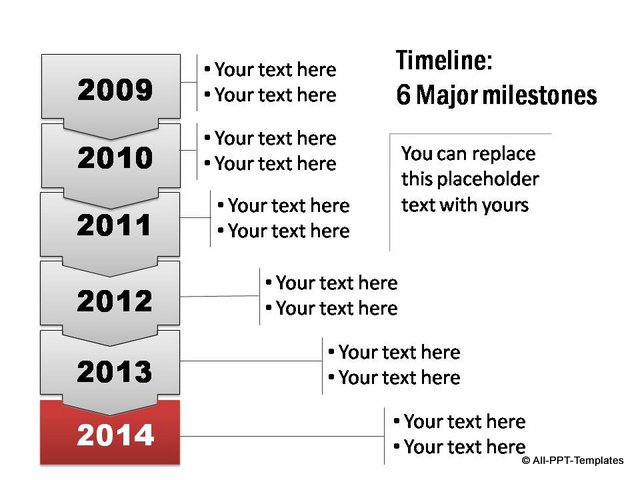
Timeline Chart showing 6 Major milestone with latest highlighted. |
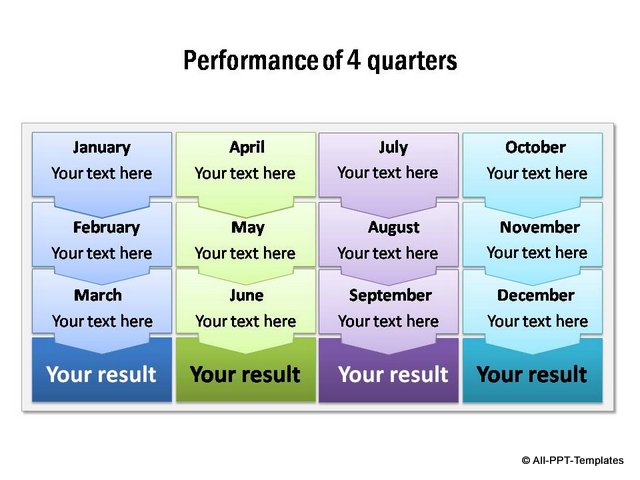
Performance for 4 quarters with monthly details and totals. | ||
|
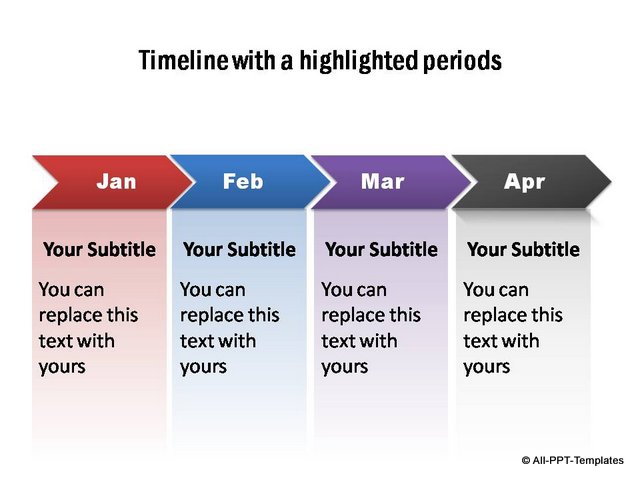
Simple multicolor chevron timeline with highlighted details. |
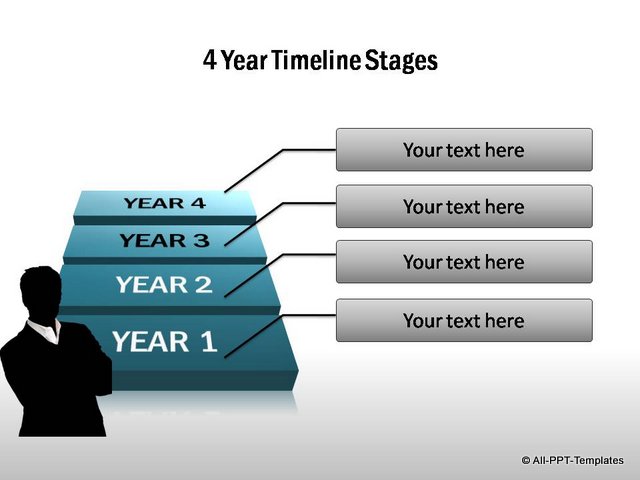
3D timeline graphic with stages for 4 years. |
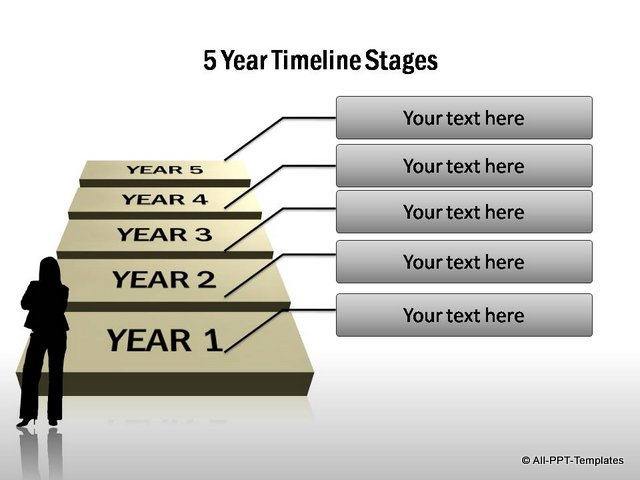
3D timeline graphic with stages for 5 years. |
Return to Top of PowerPoint Timeline Page 4
Return to Sitemap to Browse more Templates
