PowerPoint Line Chart Set
This product is no longer in stock. If you are not redirected automatically, follow the link to PowerPoint Infographics Pack : Data Charts Section
Home > PowerPoint Graph> PowerPoint Line Chart Set
 |
9 line graphs for showing trend line, forecast, stock performance and more for any
business presentation. All the templates are fully data-driven and can be used in PowerPoint 2013, 2010 and 2007. $21 |
|
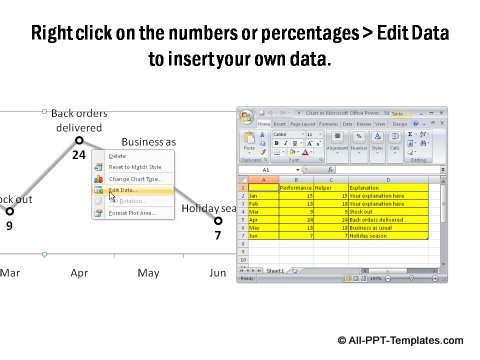
The screenshot on the left shows how easily the graphs in this set can be edited. The graphs work using the worksheet function in PowerPoint. Just Right click (Ctrl + click in Mac) on the graph, Edit Data and insert your own data.
|
Click on Thumbnails for details of all slides in this set:
This set contains:
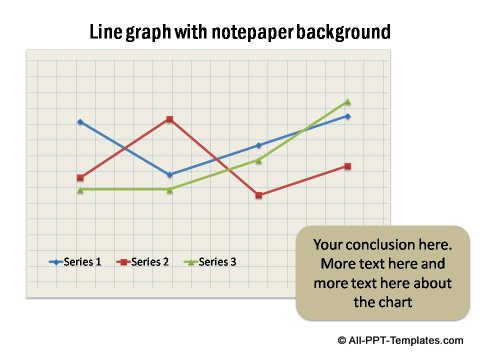
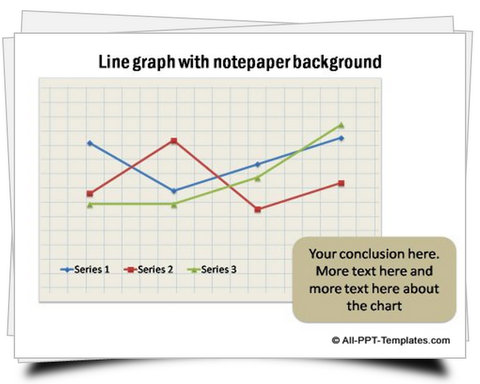
- Line graph with notepaper background.
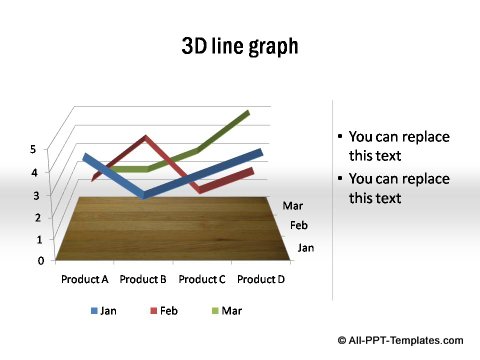
- 3D editable line chart template.
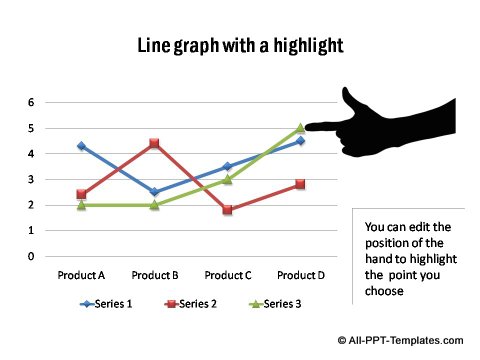
- Line graph with a highlight.
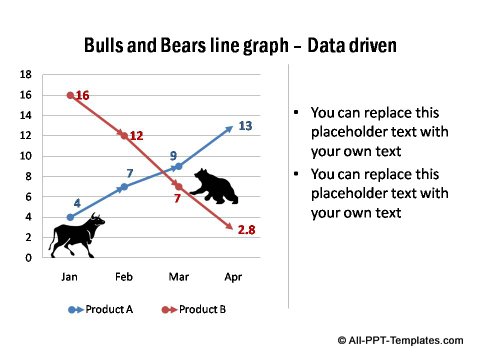
- Data driven bulls and bears stock chart.
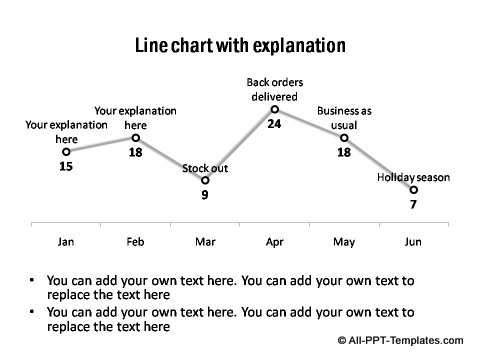
- Graph showing trend with explanation text.
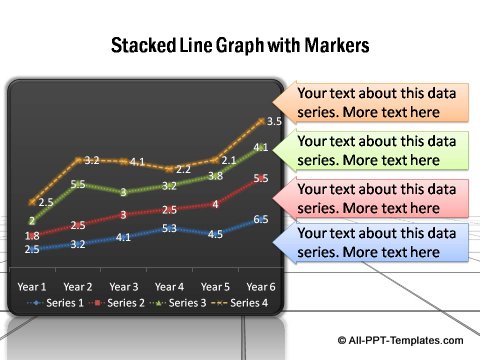
- Stacked like graph with markers.
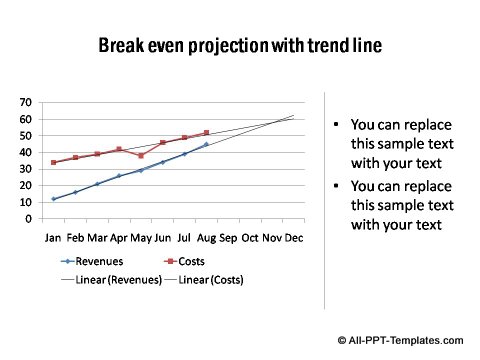
- Break even projection with trend line.
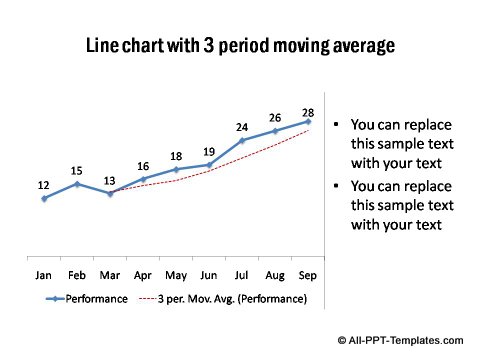
- Line chart with 3 period moving average.
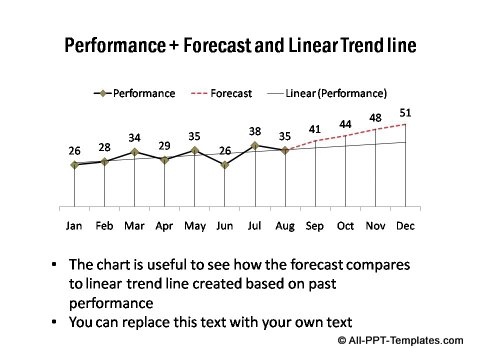
- Performance and forecast linear trend line.
Download PowerPoint Line Chart Set
Price: $21
Note: Your credit card account statement will show payment to PAYPAL*PRESENTN.
Issue or question? Contact us here
If you create presentations frequently, here is a resource for more high-end charts, graphs, infographics & more backgrounds:
Return to Top of PowerPoint Column Chart Page
Browse more PowerPoint Graph Sets

