PowerPoint Infographic Templates for Data
Part of 600+ PowerPoint Infographics Pack
Fully editable info graphics created in PowerPoint for making stunning business presentations, brochures, sales pitch etc. Get Now & Download instantly!
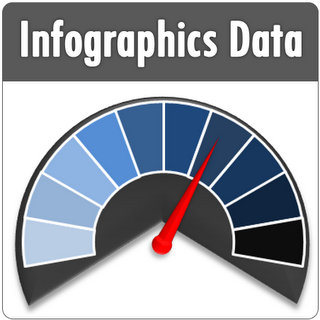 |
Find creative and fully editable infographic templates for presenting data like tachometers, barometers, sliders, scales, battery, comparison charts, yes/no charts and more. Use these stunning templates in your presentations to share your data and information. |
Click on the thumbnails below for larger view
|
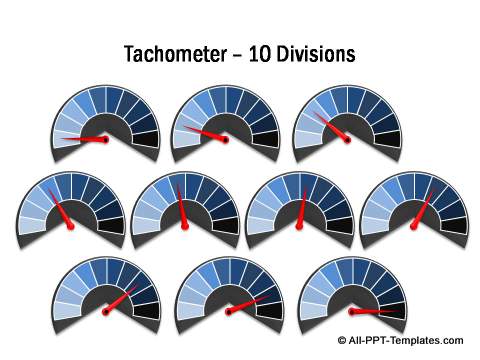
Tachometer with 10 divisions |
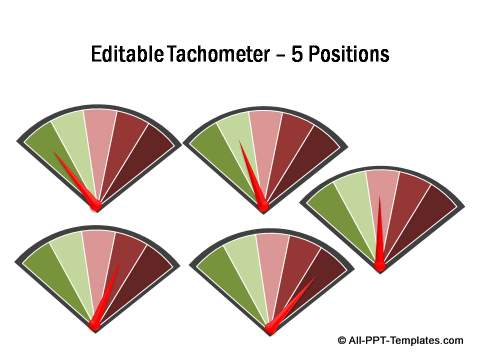
Tachometer with 5 positions | |
|
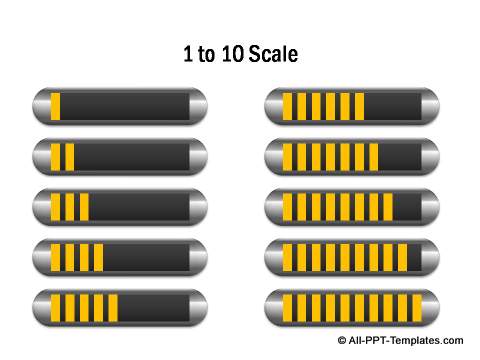
Scale with 10 bars |
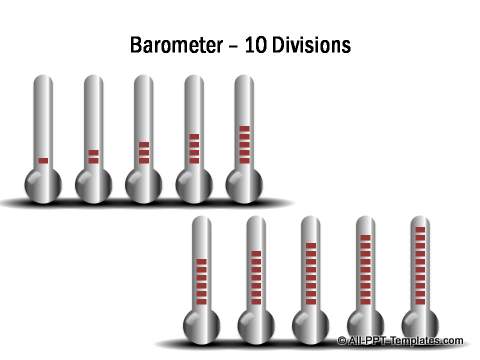
Barometer with 10 divisions | |
|
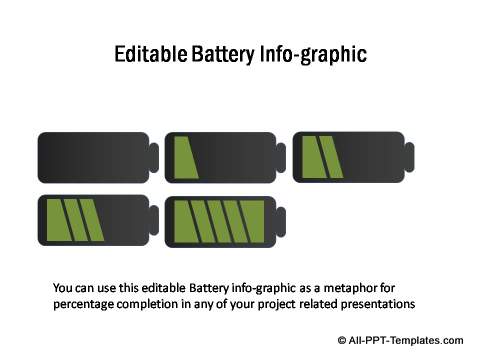
Battery Infographic |
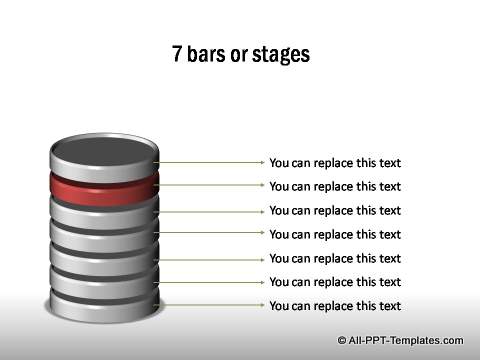
Battery with 7 bars | |
|
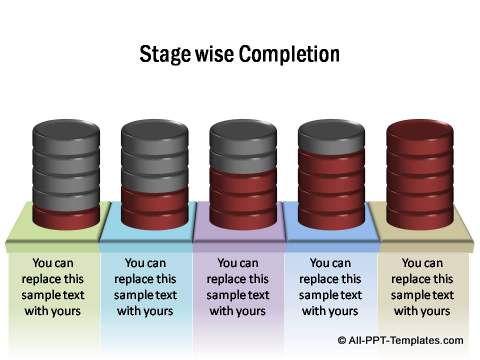
Battery showing completion |
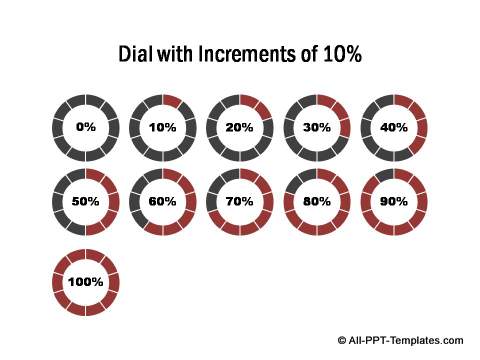
Dials with increment % | |
|
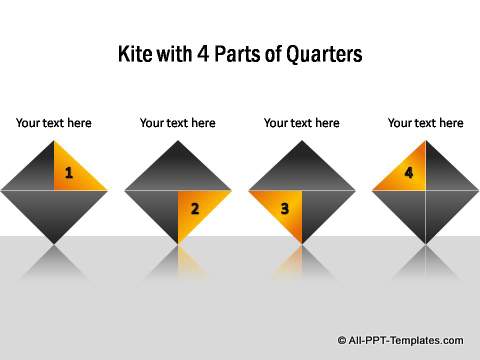
Quarters with details |
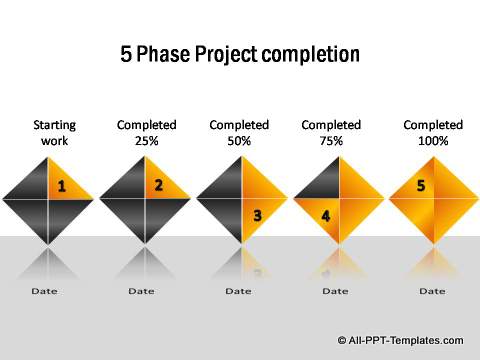
Project phases | |
|
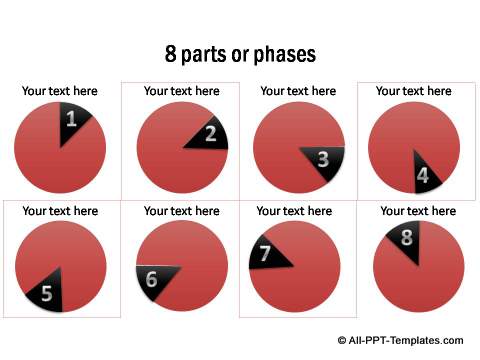
8 parts in a circle |
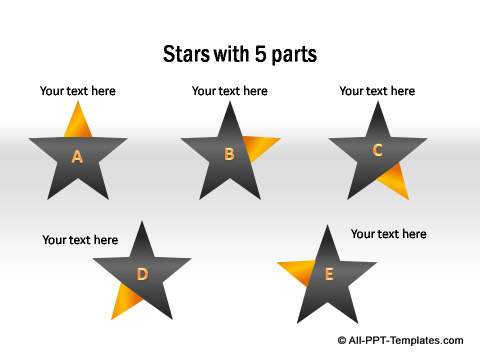
5 parts stars |
|
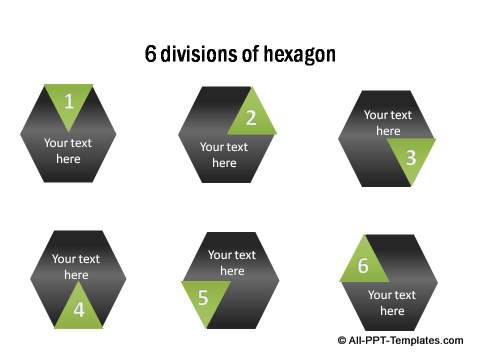
Hexagon with 6 parts |
PowerPoint Infographic | |
|
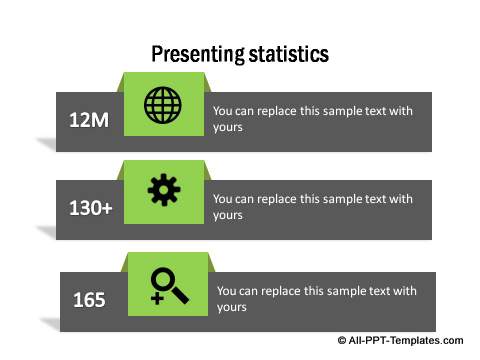
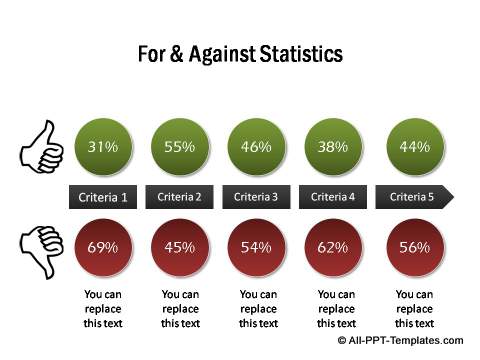
Infographic for statistics |
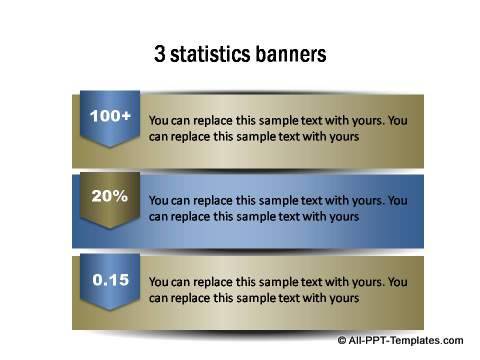
Banners with statistics | |
|
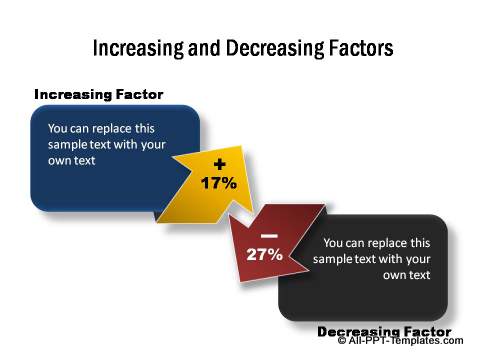
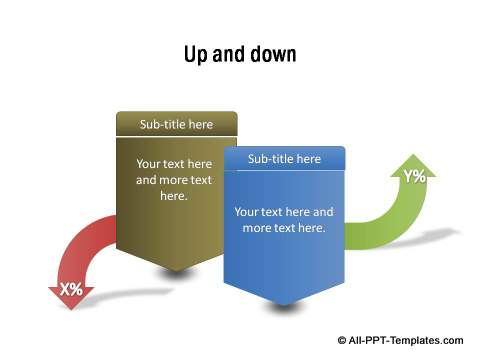
Showing ups and downs |
Infographic for statistics | |
|
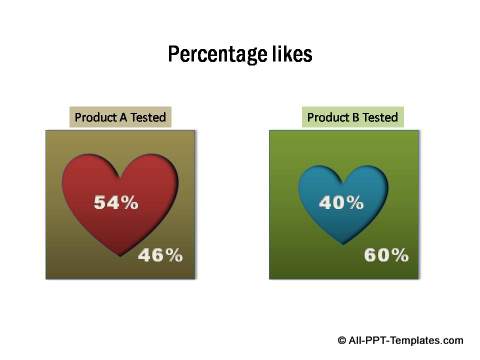
Graphic showing % Likes |
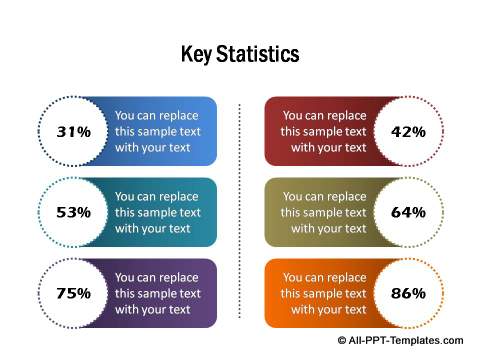
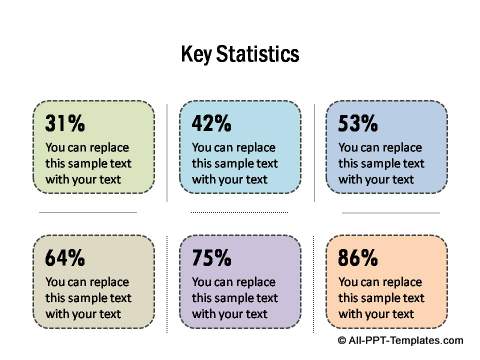
Present Key statistics | |
|
Present Key statistics |
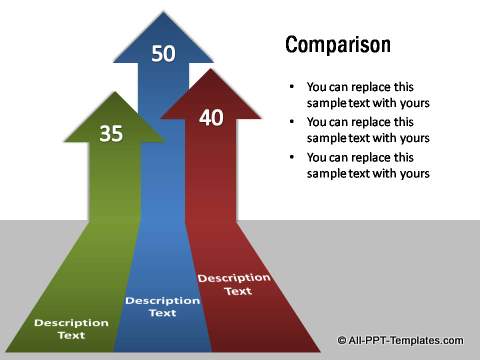
Arrows for growth comparison |
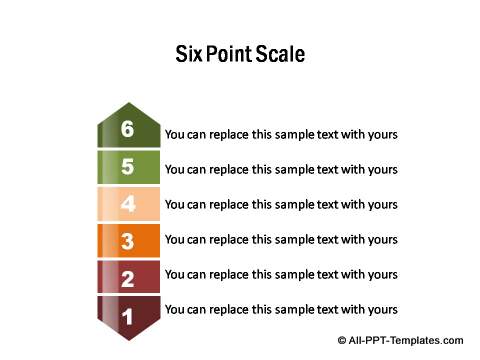
6 Point Scale
Browse Related Graphics from Infographics Pack
Get 600+ fully editable infographics to make over your next presentation...
Return to Main PowerPoint Infographics Page
Return to Top of PowerPoint Infographic Page
