Understanding PowerPoint 3D Rotation
In this article you will learn how the 3 axes i.e. X, Y and Z in a 3D Rotation option in PowerPoint works. Using the correct angle of rotation is vital to have your 3D diagrams look realistic. To use the correct angles it is essential to understand how the 3D rotation works in PowerPoint. Let us get a good understanding of the three axes and the impact of the rotation angles.
Understanding the 3 Axes:
The first step in understanding 3D rotation is to understand X, Y and Z axes. We will understand the three axes better, if we apply the rotation to a 3D icon of a man.
1. Understanding X-Axis
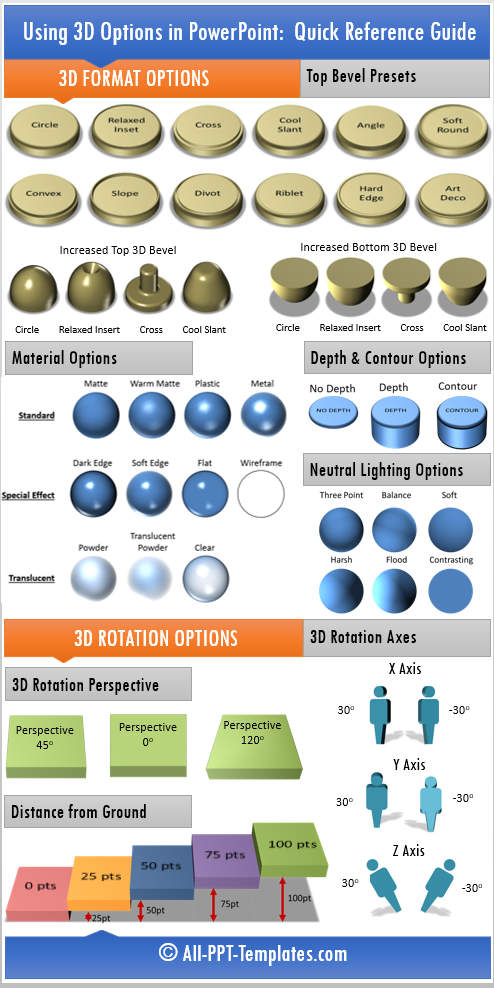
X axis rotates a shape from left to right. The more you increase the X – axis value, the more the icon faces to your left. To make the icon face to your right you need to reduce the X axis value.
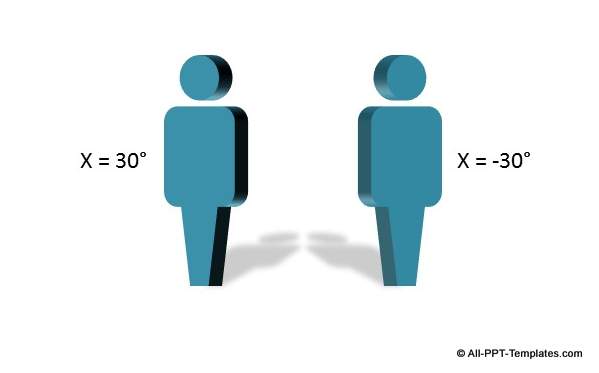
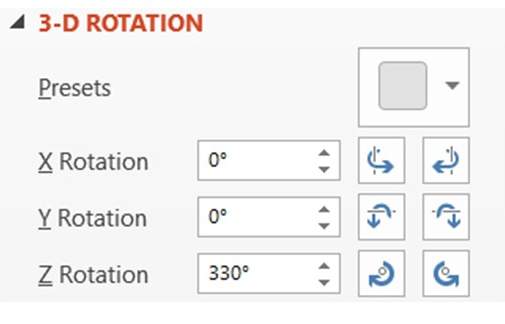
Since you can’t input negative values for the axes, -30° is equal to (360° - 30°) i.e. 330°.
2. Understanding Y-Axis
Y axis rotates a shape from top to bottom. The more you increase Y axis value, the more the icon falls to the front. To make the icon fall back, you need to reduce Y axis value.
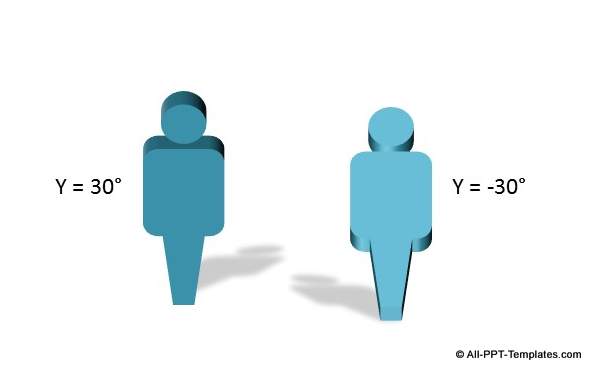
3. Understanding X-Axis
Hold a pencil with its tip touching your computer screen. Imagine that your pencil is standing in the middle of the 3D icon. Increasing or decreasing Z axis values makes the icon rotate around the pencil.
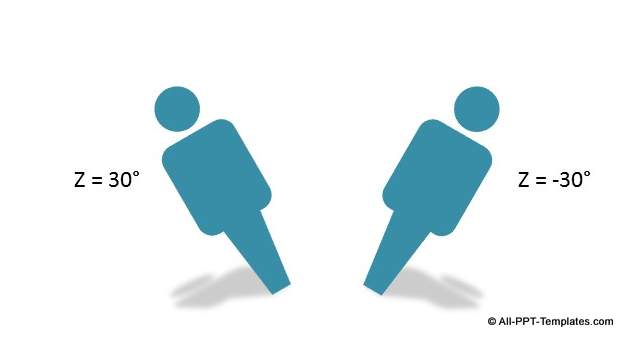
Now, you can position any shape depending on which side you want the shape to face (X-axis), which way you want the shape to fall (Y –axis) and the extent to which you want the shape to tilt (Z-axis).
Understanding the 3D rotation presets:
The illustrative icons for the various 3D presets are extremely intuitive in terms of the result you can expect when you apply a specific preset:
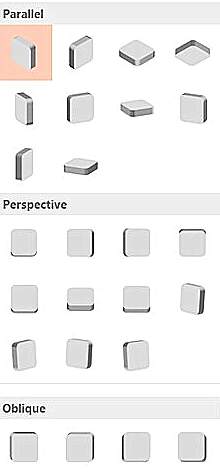
You can apply a preset that closely matches the result you are looking for and you can adjust the X, Y and Z axis based on the understanding you gained from the earlier part of this article.
Related: Learn about 3d bevel functionality here
Understanding Perspective angle:
‘Perspective’ angle option becomes active only when you apply Perspective presets.
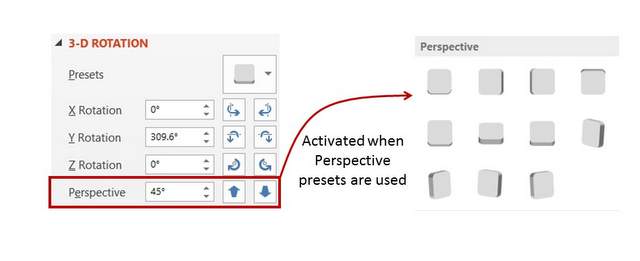
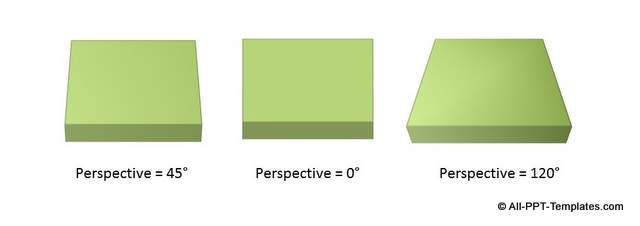
By default, the perspective angle applied to the presets is 45°. Reducing this angle, shortens the shape at the bottom and widens at the top. This is called as Foreshortening. The same way, increasing the perspective angle widens the bottom and narrows the top. The shape looks like it is photographed using a wide angle lens. The range for Perspective angles is 0° to 120°.
There is another option called ‘Distance from ground’ available in 3D rotation pane. We will discuss the feature in a separate article.
With this knowledge of how the 3D rotation
works, you would be able to create 3D diagrams easily.
Infographic with 3D options
To make it easy for you to find which 3D option to use when you are creating a 3D diagram in PowerPoint, we'd like to share this useful infographic. It summarizes the contents of the article you have just read and provides a quick reference guide. Just right click on the infographic and Save As... to save the helpful guide to your desktop.
Here are some examples of diagrams created using 3D rotation options:
Examples of using PowerPoint 3D Rotation
Here are some creative examples of how 3D rotation can be used to create a professional looking diagram :
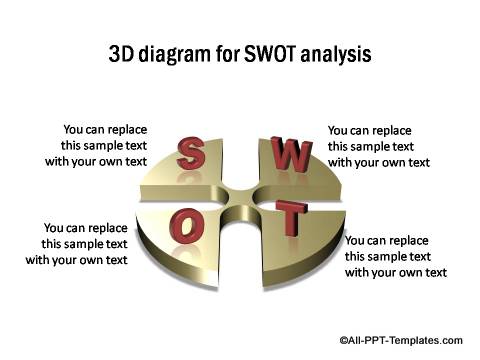
1. 3D Diagram for presenting SWOT Analysis
In the following diagram we have applied a 3D perspective to the diagram well as to the text.
Source: PowerPoint Models from All Inclusive Charts Pack
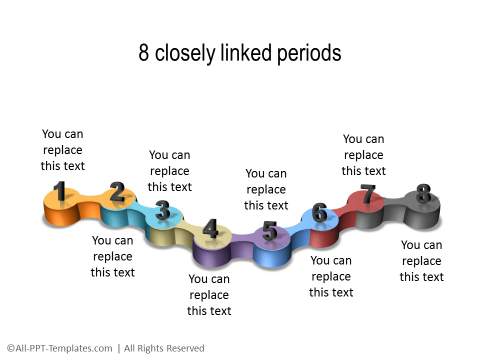
2. 6 Closely linked Timeline periods
This diagram consists of multiple 3D elements "chained" together with each link representing a stage of a timeline.
Source:PowerPoint Linear Timelines from All Inclusive Charts Pack
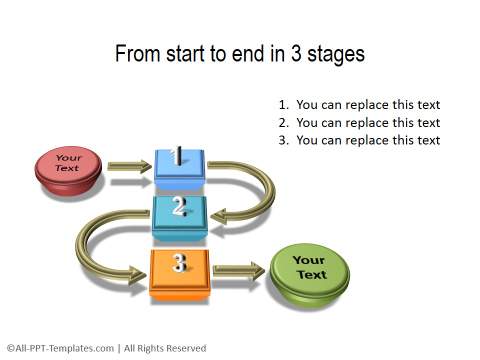
3. 3D Process diagram with 3 stages from start to end
We have used simple circles, squares and arrows to create this interesting process diagram in 3D with shadow and perspective effects.
Source: 3D Process Diagrams from All Inclusive Charts Pack
These are some of the examples of diagrams you can create using 3D rotation options.
We hope you found the tutorial and examples useful and can apply the learning to your next presentation.
Another way to impress your audience:
Applying proper angles and perspectives to 3D shapes is one way to make your slides look professional. Another way to make your presentation remarkable is to use high quality charts, diagrams and graphics in your presentations.
However, if you are a busy business presenter – you may not able to spend a lot of time building and polishing the look and feel of your graphics from scratch. That is why we came up with our 1900+ All Inclusive Charts and Diagrams Pack for PowerPoint.
All the templates are 100% editable. Just choose the template that matches your thought and replace the sample text with your own text. Your business slides get ready in no time. Creating professional quality business slides has never been easier.
Related Posts
Top of Page : PowerPoint 3D Rotation
Main PowerPoint Tutorials Page
